This is a running log of practical lessons from working with Loxone Exosphere, focused on turning real data from a Loxone Miniserver into clear visuals.
Expect short, actionable notes on databases, sensors, charts, and the small settings that make a big difference.
This post will be expanded over time as new handy insights surface during day‑to‑day use.
Database data can’t be charted
While testing Exosphere, I built a database to log several room values and assumed I could chart them in an Exosphere Chart. After checking with Loxone Support, that’s not possible: data stored in an Exosphere Database cannot be used directly in an Exosphere Chart.
Sensors not showing up when adding Data Points
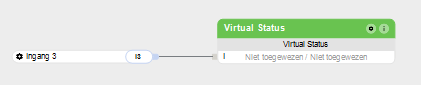
In one project, we had extra temperature readings not tied to any Function Block. I wanted to plot them in an Exosphere Chart and learned you must attach a sensor you want to use in Exosphere to a Function Block first, otherwise the data won’t be available.
If the temperature sensor isn’t used anywhere yet, attach it to a “Virtual Status” block. Once it’s linked, the Virtual Status appears in Exosphere and you can add it as a data point.
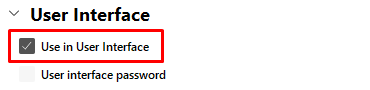
Missing Function Blocks when adding Data Points
At one point, a Function Block didn’t show up in Exosphere. The fix was to enable “Use in User Interface” in the settings of that block. If you don’t want that block visible in the Loxone App, keep it enabled but restrict access through users and rights management.